


MadCap Flare has long included the Reports functionality that allows authors to take a step back and check the overall status of all files and links in a project. Some examples of reports include a list of broken links, a list of undefined condition tags, or a list of elements not in use throughout a project. The release of MadCap Flare 2018 expanded Flare’s native reporting functionality even further with the addition of all the features of MadCap Analyzer, which used to be a standalone program. Now, with the MadCap Central September 2018 Release, you can run reports and see data visualizations directly from the MadCap Central Portal in a web browser, making them easier and more accessible than ever before.
Many documentation teams manage projects of such a large scale that it would be impossible for any individual to inspect it for problems. For this reason, it is a good idea to run Reports routinely and address critical errors that are flagged before publishing. In this post, we will walk through accessing reports in MadCap Central and a few ways you can make use of them.
Accessing Reports
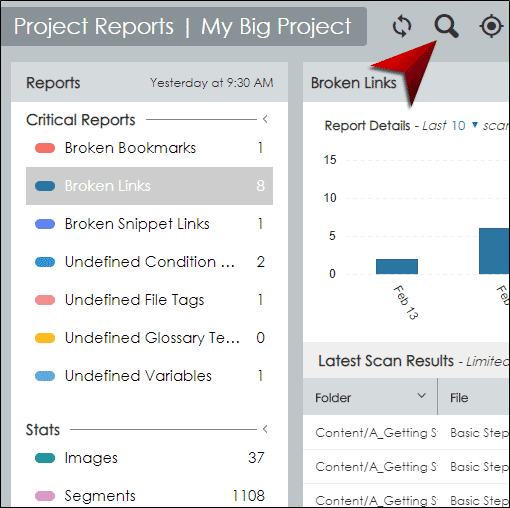
Each project in MadCap Central will have its own Reports page. To see a project’s reports, select the project from the Projects page, then click the Reports button on the right side. You can also right-click on a project in the Projects page, or click on the project icon, then select Reports.
When are Reports Updated?
A project will be scanned for reports when it is initially uploaded to MadCap Central and each time someone pushes the latest changes to MadCap Central thereafter. You can initiate a scan manually from the reports page by selecting the magnifying glass icon in the local toolbar, just like the analysis summary window in Flare 2018.
Analyzing Critical Reports in MadCap Central
Many users find value in reports that return Broken Bookmarks, Broken Links, and various undefined elements, and these reports are made available for all projects in MadCap Central.
For example, let’s say you are authoring a help system about the history of dance music. You added some content and then pushed the latest changes to MadCap Central. After the changes were pushed, MadCap Central automatically scans the project for Reports.
In the Central portal, you access the project page and then click on Reports.
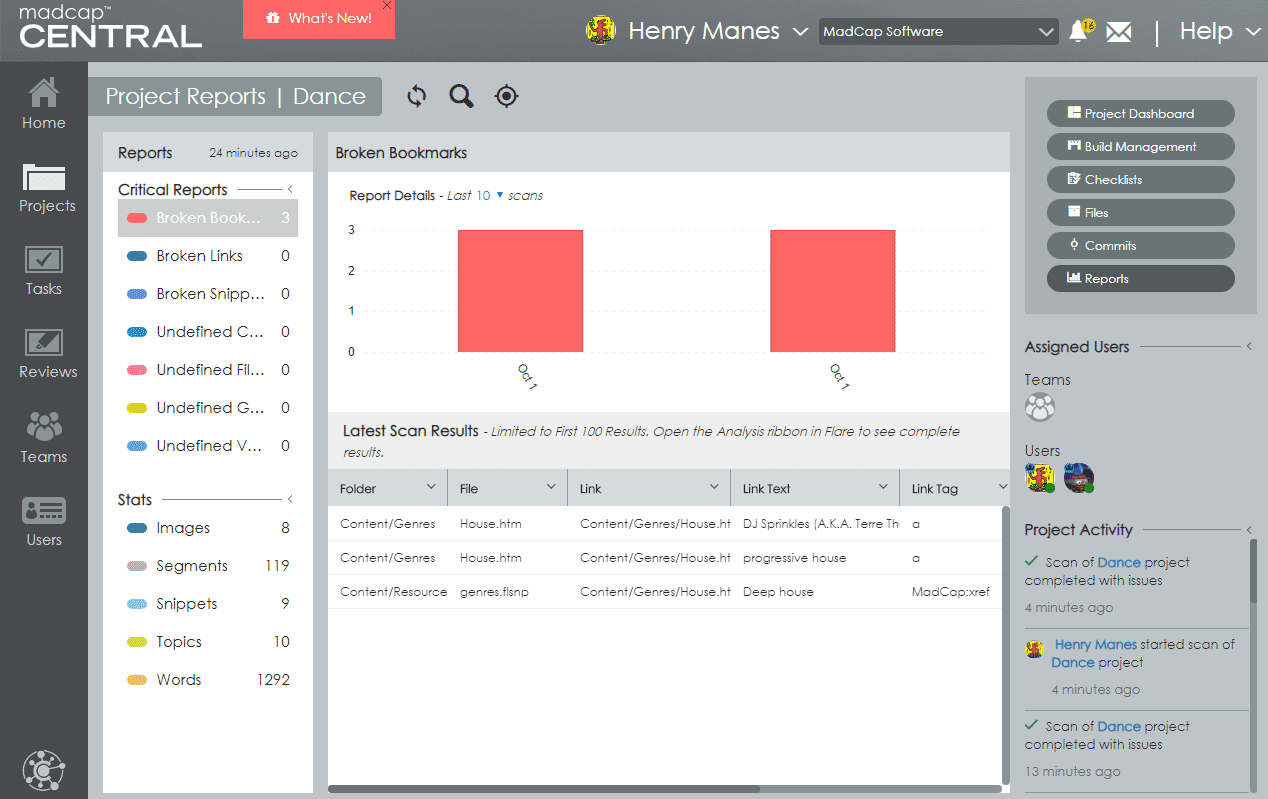
As you can see in the screenshot, the “Broken Bookmarks” report returns three links that are not correctly added to the topic House.htm.
When you select Files on the right side, you can navigate to the path of the topic displayed in the Link column within MadCap Central and inspect the element where the issue is found.
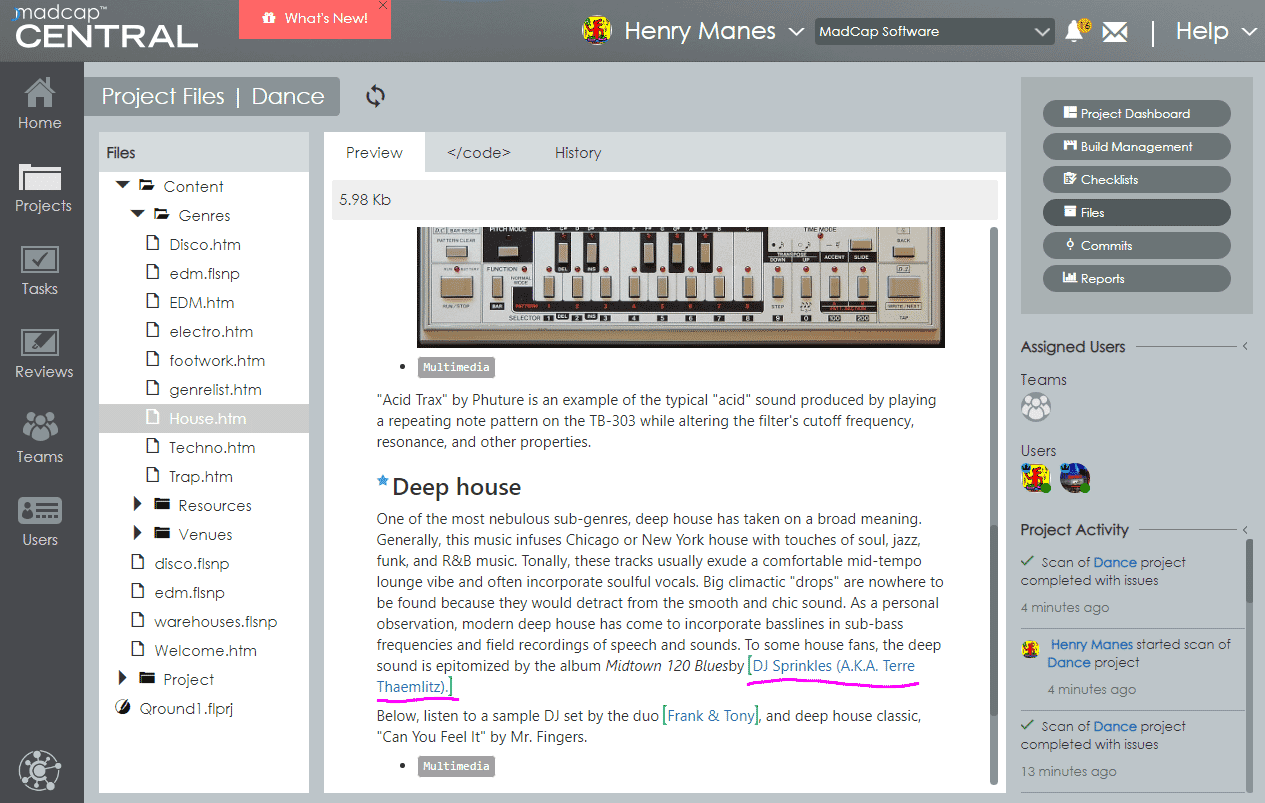
The broken bookmark link can be corrected in the project open in MadCap Flare. After fixing the issue in Flare, push the changes for MadCap Central and then view the latest report in the project’s Reports page.
For specific examples of how some critical issues can be fixed in a Flare project, refer to those sections in the post Four MadCap Analyzer Reports You Should Run on Every MadCap Flare Project and its second part, Let MadCap Analyzer Do the Work – 4 Reports to Correct Hard-to-Find Issues in Your MadCap Flare Projects.
Charts
Above the grid of files in each report, MadCap Central will generate a bar chart that visualizes how many results were returned in the most recent scans. A new bar will be added each time the project is scanned, including the times you manually initialize a scan with the magnifying glass in the local toolbar.
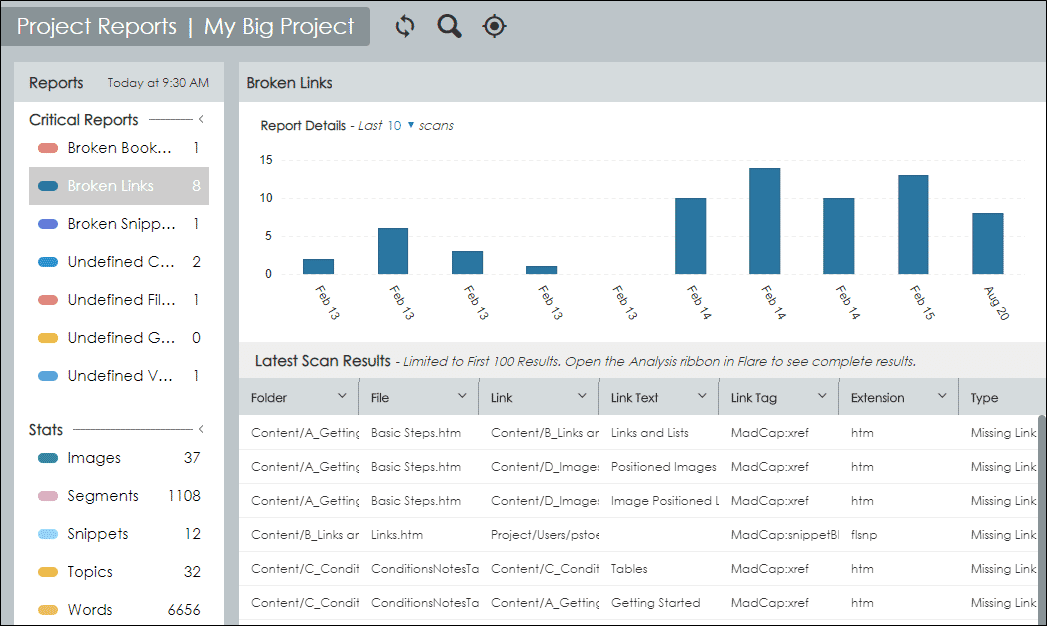
This data is displayed for each report and statistic that you select on the right side.
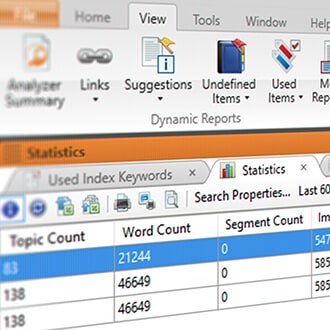
Statistics
MadCap Central will also report statistics, which are counts of how many files of each type exist in the project.
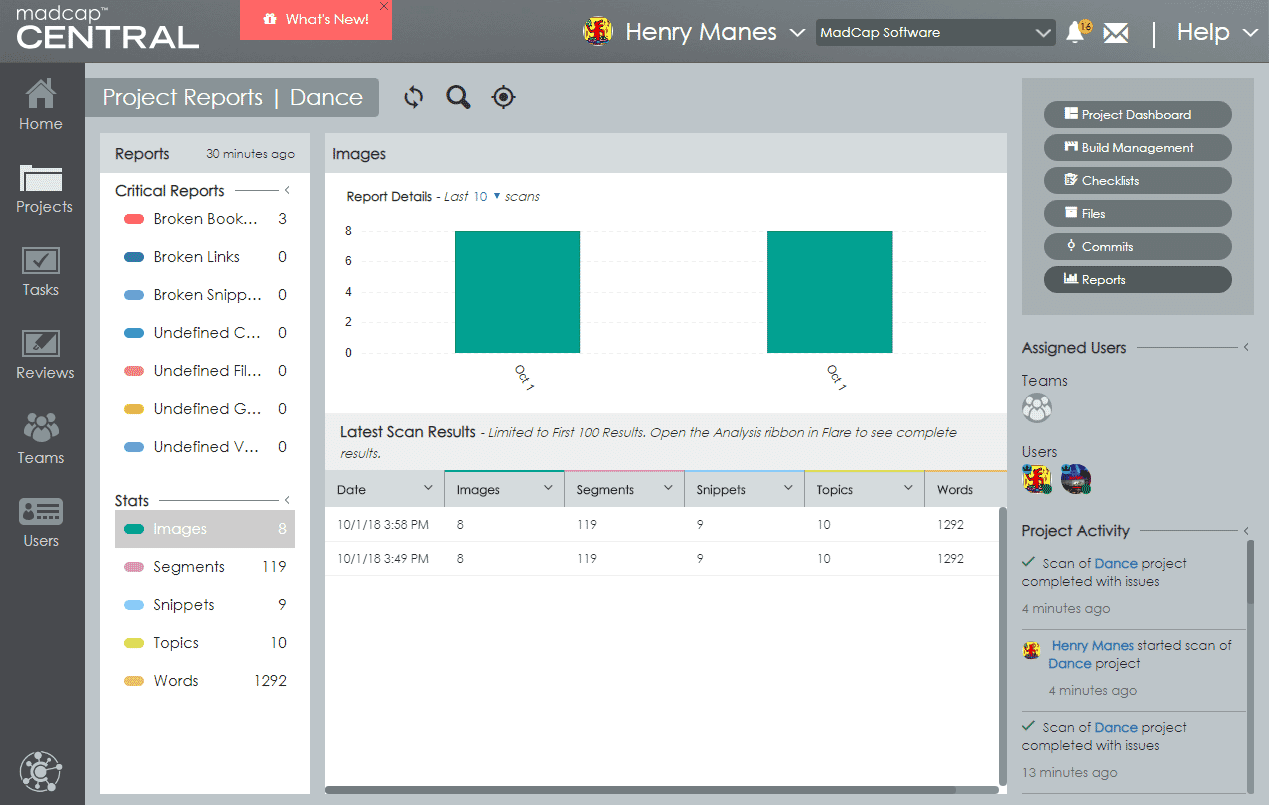
When you select a statistic from the left list, the bar chart will populate with the data for that statistic, but the grid below will display the values of all statistics.
Use Widgets for Reports at a Glance
Dashboards are a core feature of MadCap Central where you can arrange objects called widgets. The Home page of the MadCap Central portal and each project’s landing page (the Project Dashboard) are both dashboards. Widgets are snapshots of information that are pulled directly from a specific area in a project that you can place on your dashboard. You can click on a widget to access the relevant area for the information.
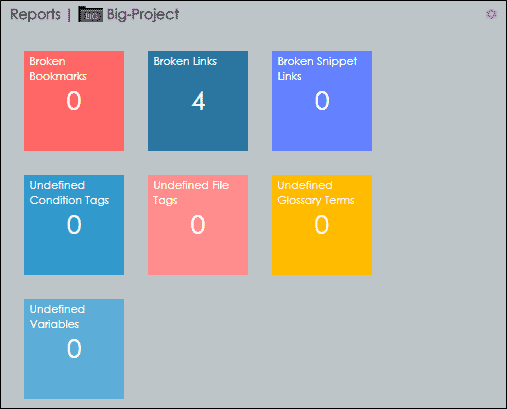
You can add a widget that displays critical reports for a project to a dashboard. The widget will display tiles containing the number of instances found for each report. When you click on one of the tiles, you are taken directly to that report in the project’s Reports page.
How to add a Reports widget:
- Open the Home dashboard or a project’s Dashboard.
- In the local toolbar, click the Select Widgets button.
- In the dialog, select Reports.
- Click Add.
- Click the button in the upper-right corner of the widget container.
- Select Filters > Select Project.
- Select the project then click Save and Finish.
Notifications
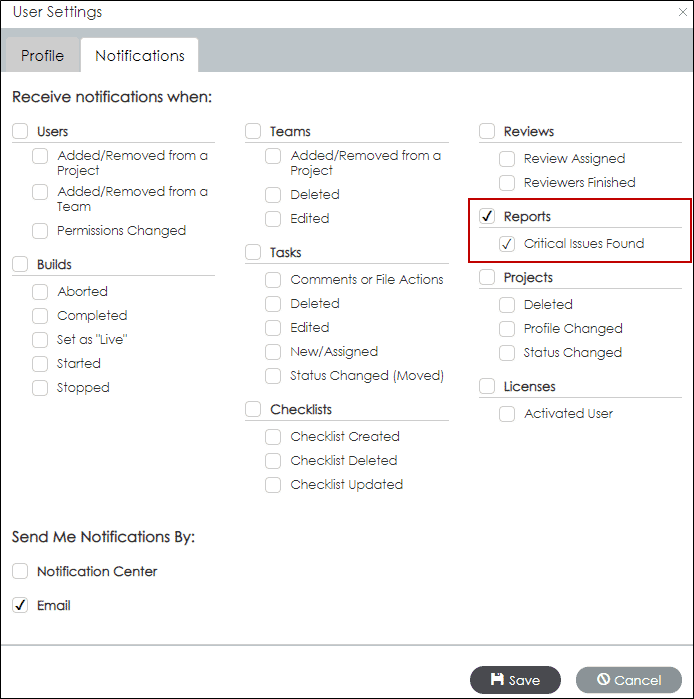
You may want to be notified when a critical issue is found in a project. To enable these notifications, select your name in the upper-right corner, open the Notifications tab, then enable Reports/Critical Issues Found.
Use Reports in Every Project
Reports in MadCap Central provide an automated system of identifying critical issues that can arise in complex help systems. These reports can complement or even substitute the more customizable Reports functionality in MadCap Flare 2018 or MadCap Analyzer. This is an often overlooked and powerful tool that can keep human errors in check and make it a little easier to efficiently and easily maintain your MadCap Flare project.
If you have any interesting use cases for reports in MadCap Central authoring tool that is not covered in this post, please feel free to share it in the comments below!
References
MadCap Central help – About Reports: http://documentation.madcapsoftware.com/central/Content/Central/Projects/Reports/About-Reports.htm