


Providing searchable and findable documentation to your end users can drastically reduce support calls. When you provide them with the answers they need, wherever they need it on whatever device they are using they become empowered, and that means you have an instant and positive impact on the bottom line.
In the MadCap Central October 2019 release, you can now get instant measurable insights on how effective your content is, and how it needs to evolve based on usage and demand.
The best part? It’s so easy! No need to manage complex tracking code, no need to install any server-side software, it is all available in Central. Your project doesn’t even have to be bound in Central, or hosted there, which makes this really flexible. In addition, you can gather metrics on as many different targets or projects you want, with your Central subscription.
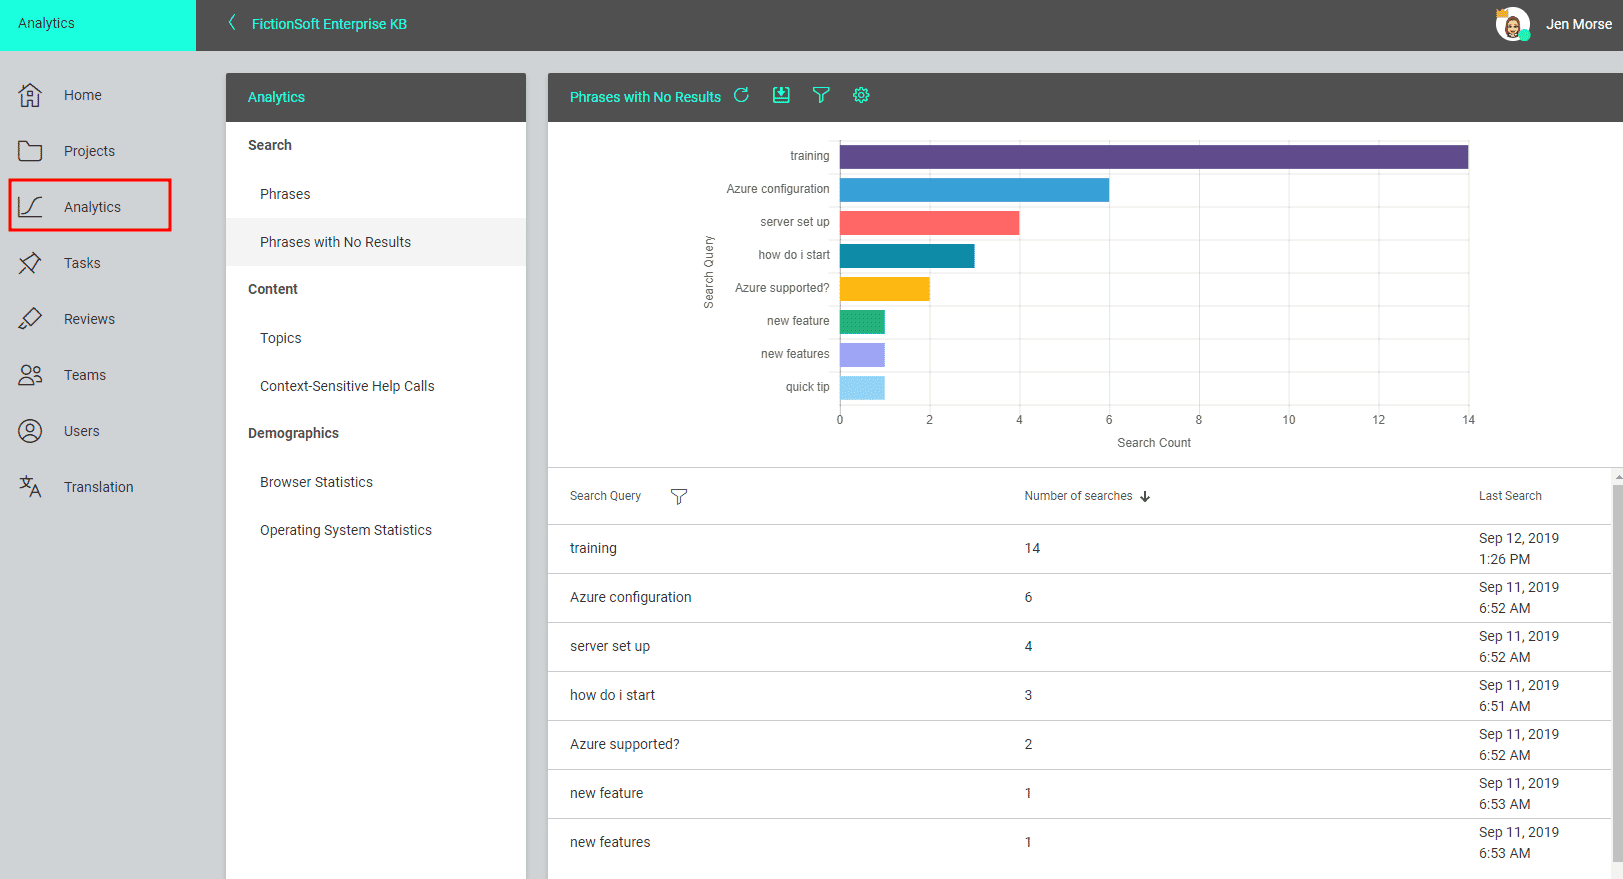
If you have a Central subscription, it is as easy as enabling a check-mark box in your Flare target. Login to Central, build and publish, then Central takes care of the rest. Central has a new Analytics page, which shows search phrases used, search phrases with no results, topics viewed, context-sensitive Help calls, and demographic statistics (browsers and operating systems):
By using Central Analytics, you can obtain the following information about your outputs:
Phrases – This report shows all search queries made to the output, including whether a search term returned any micro content results. This is useful because it indicates the kind of documentation most often sought by users, as well as whether you should create new micro content to match certain search terms. For more information on the benefits of data and micro content to improve search results, refer to this blog post.
Phrases with No Results – This shows all search phrases that didn't produce any results. This is useful because it indicates if you need to produce new documentation to provide results for users, or perhaps create synonyms that will show results for existing documentation. Reducing the number of unanswered queries has an immediate impact on increasing support ticket deflection.
Topics - This shows all topics in the output that have been viewed at least once. This is useful because it indicates the topics where you might want to focus much of your attention and ensure content is up to date.
Context-Sensitive Help Calls - This shows context-sensitive Help identifiers that have been invoked at least once in the output. This is useful because it indicates which areas of your product’s interface are most active, and perhaps even unclear to users.
Browser Statistics – This shows which browsers are being used to view your online output. The graph shows a broad view of the browsers, and the grid breaks down the information into specific browser versions. This is useful because it indicates which browsers you should focus on supporting.
Operating System Statistics – This shows which operating systems are being used to view your online output. This is useful because it indicates which operating systems you should focus on supporting. It might even be used to determine whether your company’s software needs to continue supporting certain operating systems.
When you have actionable insights like this, you will immediately see improvements in operating costs, incident/request resolution, customer satisfaction, job satisfaction, and a significant reduction in training times. For more information on enabling analytics in your Flare targets, refer to this topic in the online Help.
Up next in the MadCap Flare 2019 r2 and MadCap Central October 2019 release series is Part 3: Additional New Features in Flare 2019 r2.