


MadCap Analyzer is a powerful tool that analyzes many different areas and features of MadCap Flare projects, generating reports on issues that need to be corrected and making suggestions on how to efficiently and easily maintain your Flare project. This post covers MadCap Analyzer reports you should run to ensure a project is error-free, addressing broken links and bookmarks and content that cannot be used by Flare.
At a high level, MadCap Analyzer's strongest feature is its tight integration with MadCap Flare. This integration enables both tools to communicate with each other and see changes to files made by either tool. This means you can analyze a Flare project in Analyzer to find issues with the project and then edit your Flare content either in Analyzer or in Flare. Both tools detect the changes and update their display and analysis of the file in real time.
Why Should You Run Analyzer
Having broken links will confuse and frustrate your users, at a minimum. And if your organization does any testing of your content and help systems, bug reports will be generated against your content, which can reflect badly on you or your documentation team. In most cases, developers will compile their code before checking it in to whatever source code repository or tool your organization uses. Responsible information developers will heed their example and follow the same practices. If you don't, in the worst case, as your infrastructure builds your content as part of the nightly build, your errors might cause the entire build to fail. Even if you build your output standalone and it's pulled into the nightly build already built, again, various quality checks will find the errors and come to the attention of your project teams and management.
To minimize the risk of broken links and issues in content, you should run the following four Analyzer reports on every Flare project:
- Analyzer Summary
- Broken Bookmarks
- Broken Links, which also reports Broken Snippet Links
- Database Errors
These are the issues you need to fix to have a clean build of your project. These issues cause various types of broken links to content, either within your Flare project or to external files. You should use Analyzer to detect these issues and correct them using either Analyzer or working natively in Flare. This post focuses on using Analyzer and its ability to open a Flare project remotely and detect and correct problems. It does not cover the specific steps to correct those problems but instead will show the recommended approach to using Analyzer to find those issues in a Flare project. For further information, refer to the MadCap’s online help for the specific steps.
1. Running the Analyzer Summary Report
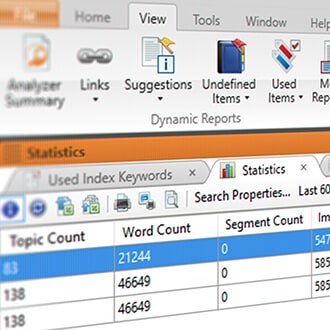
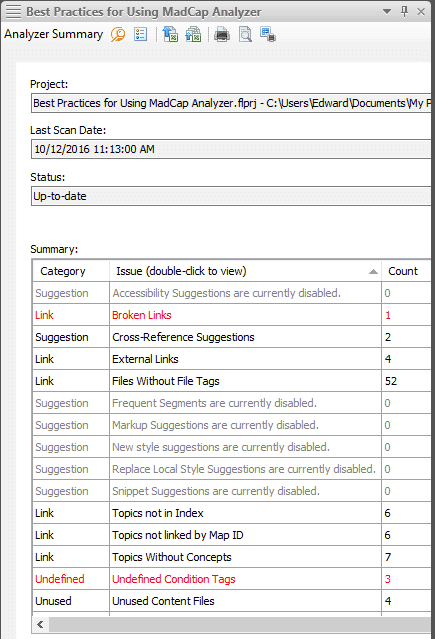
When you open Analyzer, you specify a Flare project to be analyzed. Analyzer automatically analyzes the specified Flare project and displays a visual report, called the Analyzer Summary, which provides information about the Flare project analyzed, status of the analysis, and a detailed listing of the categories and issues, as predefined by MadCap Software:
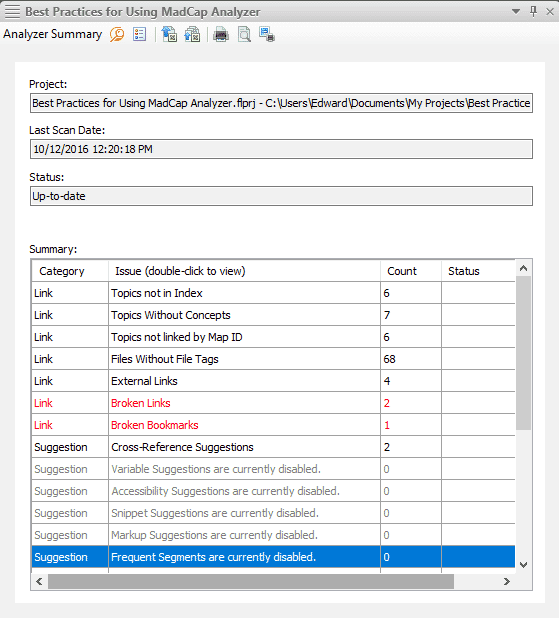
The Summary table lists the categories, specific issues, number of instances of each issue, and current status. You can sort the Summary table by column, either ascending or descending. Issues are reported under the categories of Link, Suggestion, Undefined, Unused, and Used. Note that issues predefined as critical by MadCap Software are shown in red. If there are no instances of an issue, the row for that issue is disabled. You can also export the entire Summary table or a selected row to a CSV (comma separated value) file or a comma separated text file. You can also print the entire table or a selected row.
You can view details about any of the issues by double-clicking a row in the table. For example, if you double-click on the Broken Bookmarks row, Analyzer will display the Broken Bookmarks window on the right:
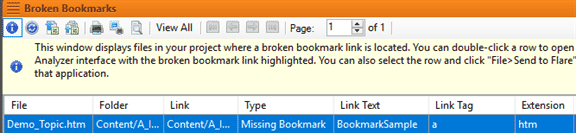
You can double-click each row displayed in the Broken Bookmarks window to open the topic containing that issue. The exact location of the issue will be highlighted in the file. This behavior applies to all the windows for categories of issues. You can diagnose and troubleshoot the issue and correct it from within Analyzer and the Flare project content will be updated.
The Analyzer Summary window updates in real time so you always have an accurate report of the state of your Flare project.
2. Running the Broken Bookmarks Report
Analyzer finds all broken links to sections in other topics in your Flare project, called bookmarks, such as a heading 2, figure, image, etc., which should be quickly addressed.
Double-click the Broken Bookmarks row in the Analyzer Summary or click View>Links>Broken Bookmarks to display the Broken Bookmarks window, which displays all the broken bookmarks detected by Analyzer.
For example, in the Demo_Topic file, there is one broken bookmark:

Double-click the highlighted row to open Demo_Topic.htm, which contains the issue:
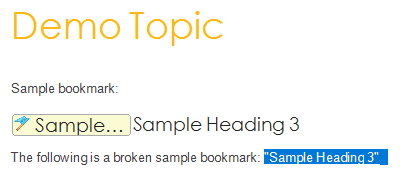
The broken bookmark is automatically highlighted by Analyzer. If you hover your cursor over the highlighted text, Analyzer (or Flare) displays the current link text, "href=sampleBoomark". You can correct the issue within Analyzer and Flare detects the change(s) to the file and updates its display if it is open or the next time you open the file in Flare.
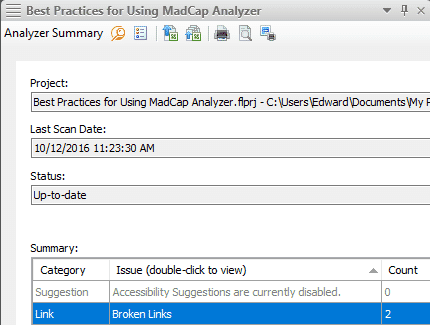
After you correct the issue, it is removed from the Analyzer Summary:
3. Running the Broken Links Report
Analyzer finds all broken links in a Flare project. Links can point to another file in your project, a place in this document (topic), an external file, another website, an email address, or an HTML Help file.
You can find broken links, display them in a listing in Analyzer, and open the corresponding files in Analyzer to diagnose and correct the issue just as with the broken bookmark example.
The Analyzer Summary shows two broken links in the associated Flare project:
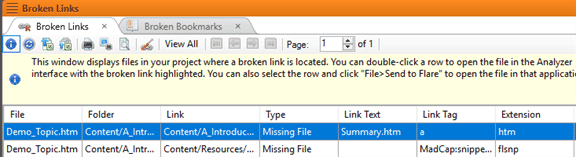
Double-click the Broken Links row in the Analyzer Summary or click View>Links>Broken Links to display the Broken Links window which displays all the broken links detected by Analyzer.
The Broken Links window shows two broken links:
- The first row reports a broken link.
- The second row reports a broken snippet link.
Double-click each row to open the file containing the broken link with the broken link selected. For example:
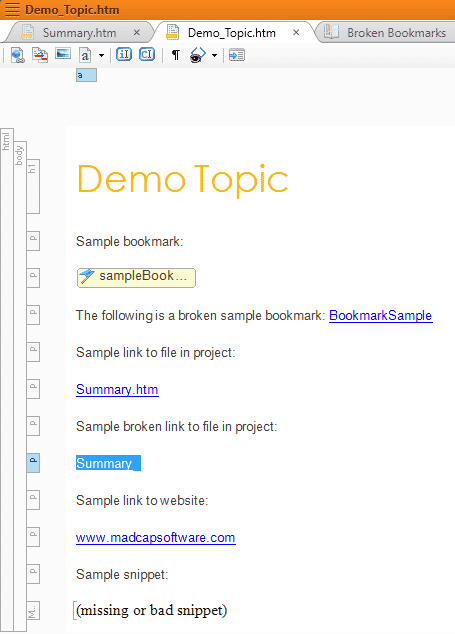
You can diagnose and correct the issue directly in Analyzer. If you hover your cursor over the highlighted content, Analyzer displays "href = Summmary.htm". In this case, it's an obvious typo with an extra "m" in the filename. Typically, you would look at the filenames listed in your Content folder in the associated Flare project to determine the issue.
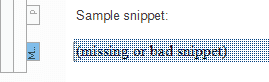
Analyzer detects any broken snippet links and reports them as "broken links", which is what they are, conceptually. Snippets are blocks of reusable text that can be formatted using the styles defined in your project. They are often used for content such as warnings, error messages, boilerplate content such as preface/front matter content, or other text that occurs often in your content.
The following shows the Analyzer message for a broken link for a snippet:
As with other broken links, you can diagnose and correct the issue within Analyzer and Flare detects the updated file and shows the new content if the file is open or shows it the next time you open the file in Flare.
After you correct these issues, they are removed from the list of issues in the Analyzer Summary.
4. Running the Database Errors Report
The Database Errors window lists all files contained in your Flare project that Analyzer cannot recognize. Analyzer detects the unidentifiable content, but typically, it is difficult to pin down what specifically causes database errors. Database errors can be caused by a number of factors, such as bad code or links pointing to bad code. When Analyzer scans bad sections of the code and can no longer scan the topic, it will log the action as an error.
Oftentimes, the issue can be addressed by opening the topic in Flare, which will point out the location of the errors. If not, then contacting MadCap’s technical support team is a quick way to solve the errors.
When to Run MadCap Analyzer on a MadCap Flare Project
There are three likely scenarios for using MadCap Flare to author content, and when to use Analyzer:
- New Flare project with no existing, legacy content - This is the case where there is no content in Flare, so you should wait until you have some amount of content in your Flare project. Then, you should run Analyzer on your Flare project to detect any problems, correct them, and have a known good baseline.
- Legacy Flare project with previous content already existing - If you inherit an existing Flare project, you should run Analyzer on it to determine the current state of the project first before working on the project. This gives you a baseline of what issues currently exist in the project. You should correct the issues so you have a clean project to work with as you add content, update, or revise the project.
- Legacy content previously in another help authoring tool newly imported into a Flare project - As with the second scenario, you should run Analyzer on the project before working on it to detect and correct any issues so you have a clean project to work with.
To review, the four Analyzer reports you should run on your Flare projects to ensure your Flare project works correctly are:
- Analyzer Summary - Displays a complete visual report of the state of your Flare project and summary information about your project including the existence and number of issues predefined by MadCap Software.
- Broken Bookmarks report - Displays information about all broken links to subsections of existing topics in your Flare project.
- Broken Links report - Displays information about all broken links to files/topics in your Flare project or external files and broken links to blocks of preformatted text that are referenced and used in multiple places in your Flare project.
- Database Errors report - Displays information about any instances of content in a file format that Analyzer does not recognize. Contact MadCap Technical Support for help if you have any of these errors.
MadCap Analyzer is a powerful tool that can scan, analyze, detect, and help you fix issues in a Flare project. It is always a good practice to run Analyzer on a Flare project first before working on updating or revising the content.
Stay tuned for my next post, where we’ll discuss the options in Analyzer that will help you “work smarter, not harder”.
Note: MadCap Analyzer is a separate, standalone product from MadCap Flare.