


Before I let you in on how great MadCap Analyzer is and how much time you’re about to save, I’d like to quickly paint a picture of a scenario that might be too familiar to some. Picture it: you’ve inherited legacy projects, yes, plural, and each project contains hundreds of files you need to review. As you begin to sift through the published online help for guidance, you notice a few hyperlinks are broken, some cross-references don’t actually work, and the note you’re reading should actually be hidden and not published. Oh, and all of those blips apply to only one of the legacy projects, which makes you wonder what awaits you in the other projects.
If you couldn’t tell, I’ve been in that situation before, and I tried to somehow manage all of this information in a spreadsheet…a spreadsheet! Needless to say, it got crazy fast, and I knew there had to be an easier way. MadCap Analyzer to the rescue!
What is MadCap Analyzer?
To put it simply, Analyzer is the best friend you didn’t know you needed in your life, or to borrow from the MadCap Analyzer Overview on the MadCap Software website, it’s “a powerful analytic and reporting tool for your Flare projects.” With Analyzer, you can quickly, and easily, find critical issues in your Flare project, like the dreaded broken link, and tidy up your project at the same time.
Want to see a list of every external link in your project and check if the links actually work? There’s a report for that. Want to see a list of unused content files? There’s a report for that too. Want writing suggestions that tell you where you accidentally went from an h1 heading to an h3 heading? You guessed it; there’s a report for that too.
Getting Started with Analyzer
This may be obvious, but before you get started, make sure Analyzer’s installed on your machine. After that’s taken care of, be sure you have the latest version of your Flare project. (That statement is made under the assumption that your project is bound to some type of source control. If it’s not bound to source control, that’s okay too, but you want to make sure you have the most up-to-date version no matter what.)
You’re now ready to open Analyzer and experience the wonders!
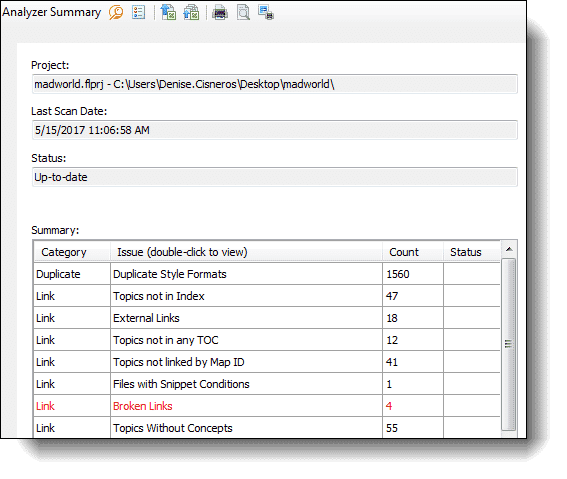
Open Analyzer and navigate to File > Open to browse for your project and open it. After you officially open the project, you’ll see a progress bar while Analyzer scans your Flare project. When the scan completes, you’ll see the Analyzer Summary, which will look like a table with multiple rows of information.
Reviewing and Fixing Issues in Your Project
Personally, I like to address the items in red from the Analyzer Summary first because they’re the most critical, so in the example above, I’d want to address the broken links. To review the list of broken links, all you need to do is double-click the row from the summary, and a new tab will open up that shows you exactly where you have broken links in your project.
What I really love about Analyzer is how specific the results are. If you look at the Broken Links results below, you’ll see the results tell me exactly where the issue is. In the first row, I can see there’s a broken link in my Master TOC file, and I can find that file in the Project > TOCs folder in my Flare project. Additionally, I can narrow down the issue even further because I can see the link in question at a glance, see the type is a Missing File, and see that this issue applies to a TOC Entry.
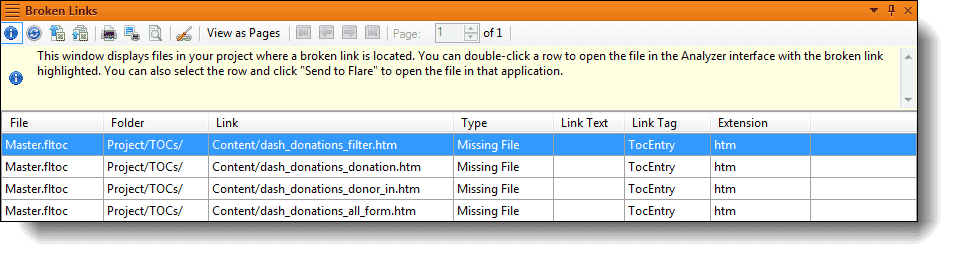
I just want to reiterate that all of this information is provided at a glance without running any additional tasks. It gets better though! You can fix these issues all from Analyzer without ever opening Flare. In the case of the Broken Links example, simply double-click a row, and Analyzer will open up the file, and even highlight exactly where the issue is, so you can fix it.
If your Flare project is connected to Source Control, you’ll see the Source Control tab in Analyzer the same way you see it in Flare, which means you don’t have to open Flare just to check in or commit any files you’ve recently changed.
Cleaning House aka Cleaning Your Project
I briefly mentioned how you can address critical issues in your project, but now I want to help you clean up your Flare project too. One of my favorite categories in the Analyzer Summary is the Unused category because the files you find in these sections hint at what can potentially be eliminated from your project.
When you open the Unused Content Files report, you’ll see a list of files in Content Explorer that aren’t used anywhere in your project. I definitely will not recommend deleting everything that shows up in this list, but I will suggest reviewing the files because they might be unused for a reason. For example, you might not be using a topic in a TOC yet because it’s still in draft mode for a future release. On the other hand, you might find that an image isn’t used anywhere because it was replaced with an updated version; in this case, you’d probably want to delete the old, outdated image.
Saving Time
You may be thinking, “Even though these examples are the most exciting thing I’ve ever read, how will Analyzer save me time?” That’s a great question.
As technical communicators, we do so much more than “write manuals;” we attend multiple meetings, create a variety of deliverables, review UI text and error messages, and then maybe get to sit down and write at the end of the day. You could probably even add more to that list without even trying. With that said, there’s not enough time to go back and fix critical issues that made it into your published content.
Instead, let Analyzer save you time and heartache by finding critical issues and clutter for you. Because of Analyzer, my team and I are able to spend more time improving the quality of our content instead of spending time manually looking for issues or sifting through spreadsheets of content we’d need to revisit later. (I may or may not use spreadsheets like that in a previous life before a team member reminded me about annotations.)
Final Thoughts
Like I mentioned, MadCap Analyzer is one of my favorite tools because I can get an in-depth analysis of my Flare project in minutes; however, everything I mentioned is just the tip of the iceberg for Analyzer’s usefulness.
I hope you’ll join me for my upcoming webinar “MadCap Analyzer: The Missing Piece in Your Workflow” on June 20, 10 AM PST, where I’ll teach you how to take your Analyzer skills to the next level by exploring more default reports, custom reports, and how you can incorporate custom reports in your workflow.